This module I had the pleasure of reading and exploring Module 2: Design Principles for Effective and Accessible Multimedia. I really enjoyed this module as I got to learn about accessibility in design. There are so many hidden aspects of having a disability that I would have never thought about and I am glad this module has opened my eyes. I also got to learn how to create effective PowerPoints and infographics. Creativity and presentations do not come easy to me so learning guidelines to create both multimedia gave me confidence and practice in making them.
Reflection Questions
What did you find when you ran the WAVE accessibility report on your blog post(s)? What did you expect and what was surprising? Is there anything you will do differently going forward?
When I used the WAVE accessibility report, I was pleasantly surprised. When I created my site, I regretfully had not really thought about accessibility methods. My summary report is seen below.
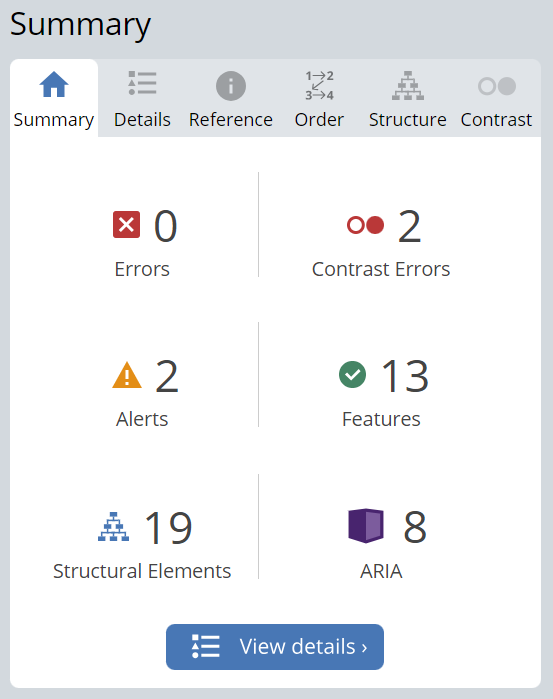
I had zero errors, two contrast errors, two alerts, thirteen features, nineteen structural elements, and eight ARIA. I investigated the two contract errors. These were regarding my username and “ 0 comments” font that were a colour too similar to my sites’ background colour. This is something I would have never been aware of had I not created the site, so I am glad to have been made cognisant of this.

I had also created an alert that warned me that I posted a video. Reflecting back to the module 2 lesson and readings, I should have added captions to this video and alternate texts to all my images.
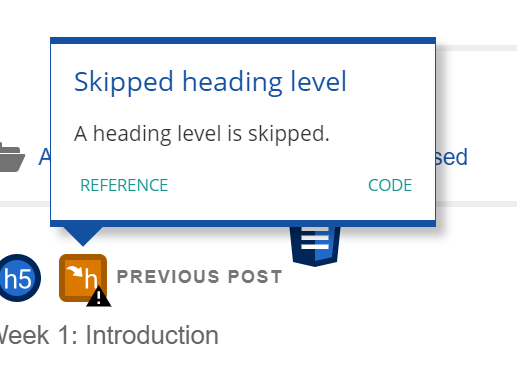
I will ensure going forward that I employ more accessibility methods like this. Lastly, there was an error that a title heading had skipped a heading level. I was not aware of this issue, so I plan to investigate to see if this can be fixed.
Overall, I really enjoyed using the WAVE report as it made me think outside of the box and ensure I include aspects that provide better learning to people of all accessibility levels. I will be sure to use WAVE in my future module posts and any work I do outside of the classroom.
Have you used Text to Speech tools before? Did you find it useful? Did you try out some of the different voices? What impact did the different voices have on your ability to absorb information?
I have never used Text to Speech tools before. I fortunately do not have any audio disabilities, so I have never needed to use tools like this before. I did find the tool useful as sometimes my eyes hurt and listening can be easier than reading. Sometimes I still have a difficult time sounding out words and this tool takes that frustration away. I did try a few sample voices including Gwyneth Paltrow, a British woman, and Snoop Dog. I really enjoyed Gwyneth’s voice as it was soothing and calm – I felt relaxed and was better able to absorb the information. I also listened to a British woman’s voice. I am not used to the British accent, so I sometimes had to rewind a few times to fully understand. Snoop Dog, on the other hand, made me laugh and it actually became a distraction. So for studying I don’t think Snoop Dog would be a good idea, but when I need a laugh it would be a great choice.
What does inclusive design mean to you?
Inclusive design means presenting media with a careful consideration to one’s visible or invisible disabilities. There should be allowances to people with behavioral, sensory, physical, or developmental disabilities. This can include alterative text, captioning, recording presentation, videos with controls, and much more. Although it seems to be extra work for a small percentage of viewers, inclusive design can help a magnitude of people. For example, I find captioning on videos extremely helpful. They allow me to understand people speaking with an unfamiliar accent and see the spelling of words. Furthermore, recording a presentation may help someone who has chronic fatigue syndrome, but it can also help myself by viewing old lectures to review content. Inclusive design must include everyone, regardless of disability, in accessible learning and subsequently help others with their learning.
What do you think the presentations in The World’s Worst Powerpoint Presentations have in common? Which design principles and which other principles (Mayer’s, Inclusive Design, UDL) are they missing?
The World’s Worst PowerPoint Presentations were all unpleasant and confusing to view and understand. I was not able to easily learn from any of the slides. “The Endless ‘Summary’” was just too much of a cognitive load on my brain. There was too much text and information at once, which is part of the Mayer’s segmenting principle. Additionally, the image in the background was distracting, which is a part of the redundancy principles. There was also no use of the Mayer’s signaling principle to important parts of the text. As for the universal design for learning, there was no engagement, representation, or action and expression. In my opinion, it was an overwhelming and somehow dull PowerPoint slide. The slide entitled, “A Symmetrical Rainbow of Confusion”, was equally horrible. The last slide had no signaling, whereas this slide had too much signaling. Almost every word on the slide was coloured, there were odd bullet point shapes, and an unexplained background image. There was too much information on this slide, which should be fixed with the segmenting and modularity principles. There should also be some spatial contiguity as text seemed to float on the screen without explanation. There should have also been balance and negative space on the slide to ensure the design was well done. Lastly, to ensure inclusivity, all the presentations should have included recordings with audio and captioning.
Which design principles did you use to create your infographic in Canva? Which elements of a ‘good infographic’ were you able to incorporate? What other principles did you consider? What does the template make easier and what does it make harder when creating your infographic?
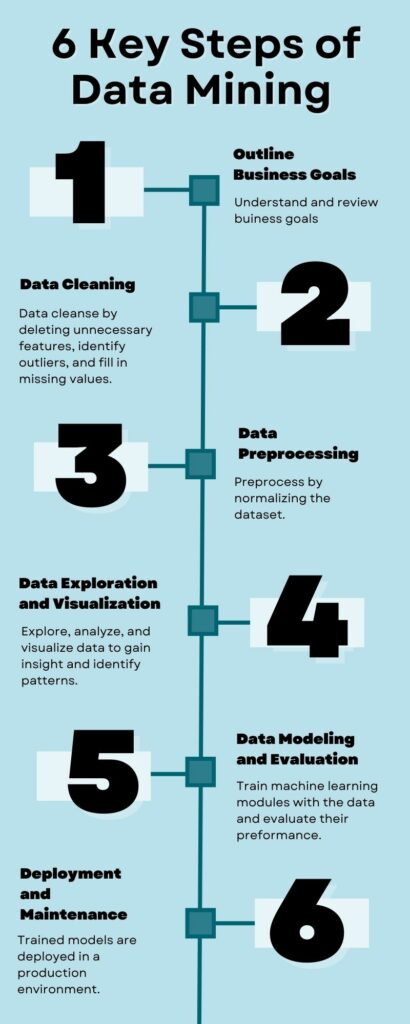
When creating my infographic, I attempted to include all design principles. I tried my best to ensure that each part of the infographic was in alignment with the other sections. I used hierarchy by having a list from one through 6 from the top to the bottom of the infographic. I included balance as I had three steps on each side. I used a blue colour palette that provided unity and pleasantness. I applied repetition by having the same format for each step of the infographic. I also used proximity by having each number beside its retrospective text. Unfortunately, there were a few elements I was not able to include. Although I used a black font with a white shadow for the numbers, I could have used orange to contrast the blue in other areas. However, I was following a template and did not want to stray too far from it. I could have also used more negative space. I did really enjoy using a template as it looked very nice, and I knew before beginning my final product it would look professional and polished. However, my template had seven steps and my final infographic had six. Because of this, I had to reposition each number to fill the infographic properly. This caused the alignment to be changed and this was difficult for me to fix. Templates are a great tool when beginning a project but if a lot of customization is needed, it may be better to start from scratch.
Graphic design is inherently visual – what additions or modifications could you make to ensure that learners with visual impairments have access to the same information in an infographic in an online setting?
To ensure learners with visual impairments can access information on infographics, I think the most important thing would be to have an alternate text. This way, text to speech readers are able to describe an image to the learner. In addition, the text should be extremely detailed and descriptive; it should not only describe what is on the infographic, but also describe the colour palette, images, and infographic flow. For example, my infographic below would have an alternative text that states: An image of an infographics with a light blue colour palette is presented. 6 Key Steps of Data Mining (1) Outline Business Goals: Understand and review business goals. (2) Data Cleaning: Data cleanse by deleting unnecessary features, identity outliers, and fill in missing values. (3) Data Preprocessing: Preprocess by normalizing the dataset. (4) Data Exploration and Visualization: Explore, analyze, and visualize data to gain insight and identity patterns. (5) Data Modeling and Evaluation: Training machine learning modules with the data and evaluate their performance. (6) Deployment and Maintenance: Trained models are deployed in a production environment.
References
Mayer’s 12 Principles of Multimedia Learning. (2023, June 2). Digital Learning Institute. https://www.digitallearninginstitute.com/blog/mayers-principles-multimedia-learning/
Hi Maya!
I really appreciate your detailed reflection on your experience with Module 2, as well as your exploration of accessibility and the use of the WAVE accessibility report. It’s evident that you’ve gained valuable insights and are actively seeking to make your online content more inclusive. The results of your WAVE accessibility report were encouraging, with only a few minor issues detected. I had a lot more then you which was really interesting to see. The contrast errors you discovered were an important find, as they can significantly affect the readability of your content for various users. This newfound awareness will undoubtedly lead to a more user-friendly and inclusive blog the next time people visit it!
Your dedication to inclusivity and accessibility extends beyond the technical aspects of design and extends to your willingness to create content that can be understood by people with various abilities. You’ve recognized the significance of adding alternative text for images and captions for videos, which greatly benefit individuals with visual or hearing impairments. This approach aligns perfectly with the principles of inclusive design and Universal Design for Learning, which advocate for accommodating a broad spectrum of abilities to create more equitable educational experiences.
Your personal experience with Text to Speech tools highlights their versatility. While they are invaluable for individuals with visual impairments, they can also provide an alternative way of consuming content for those without disabilities. I also tried out the different voices that you experimented with! Gwyneth Paltrow’s soothing voice exemplifies how audio presentation can enhance the absorption of information, underlining the importance of providing options to cater to individual learning styles and comfort!
Your interpretation of inclusive design is both comprehensive and empathetic, which I absolutely love . It goes beyond addressing visible disabilities to consider the diverse spectrum of abilities, whether they are physical, cognitive, sensory, or developmental. Your example of how captions on videos assist in understanding diverse accents and improving spelling underscores the profound impact of inclusive design. I am the exact same way when it comes to captions. It not only accommodates individual needs but enhances the learning experience for everyone.
I appreciate that you’ve noted their fundamental design flaws in the worlds worst powerpoints and identified the absence of key principles, such as Mayer’s principles and principles of inclusive design and UDL. Your reflection on these issues demonstrates your awareness of what constitutes effective and accessible multimedia. Recognizing these shortcomings is essential to avoiding similar things in your own work!
Lastly, your approach to creating the infographic in Canva is great. You’ve diligently incorporated various design principles, which undoubtedly contribute to the visual appeal and effectiveness of your infographic. The idea of customizing alternative text for learners with visual impairments is superb. It shows a clear commitment to accessibility and an understanding of the importance of making information equally accessible to all. I really liked you infographic.
Overall, I really enjoyed reading your blog and I thought it related to a lot of things I noticed in my reflection as well. Your reflection demonstrates a deep understanding of the module’s content and principles of inclusive design and accessibility. Your commitment to creating more accessible and engaging content is evident, and your willingness to experiment with new tools and approaches is super great to see. I know that moving forward in this course you will do an excellent job in making your online materials more inclusive and user-friendly for a wide range of learners 🙂
Hi Maya,
I appreciate your Module 2 post and the thoughtful exploration of accessibility, including the use of the WAVE accessibility report.
It’s encouraging to see that your WAVE accessibility report yielded only two contrast errors, a stark contrast to my assessment, which identified nineteen contrast errors on my site. Your example serves as a valuable benchmark for improvement. Recognizing these contrast errors is critical as they profoundly impact the content’s readability for diverse users. Your proactive approach to addressing these issues by incorporating captions for videos and alternative texts for images aligns seamlessly with the principles of inclusive design and Universal Design for Learning, which emphasize the importance of accommodating a wide range of abilities for creating equitable educational experiences. This module has certainly enhanced our group’s awareness of the importance of inclusive accessibility measures, which will be invaluable in future modules.
I concur with your perspective on the Text to Speech tool; it can be both entertaining and occasionally distracting from the learning process. In your discussion of what inclusive design means to you, you emphasize the value of speech-to-text and video captions in enhancing the understanding of media content. I share your sentiment on the usefulness of video captions, particularly for lectures, as they bridge language barriers and provide the option to see the spelling of unfamiliar words, aiding comprehension and contextual understanding. Your interpretation of inclusive design is not only comprehensive but also empathetic, reflecting the admirable goal of encouraging society to embrace inclusive design to ensure accessible learning for everyone, regardless of disability.
Your keen observations regarding the deficiencies in the “World’s Worst PowerPoint Presentations” resonates with me. The overload of information, colours, varying bullet point shapes, and irrelevant images certainly hampers the learning experience. Your analysis underscores the significance of maintaining consistency in font sizes, colour themes, structure, and minimizing text, with potential remedies found in principles like segmenting and modularity. This relates with Easel.ly (2021) and Visme (2017), which provide recommendations for designing infographics, embrace principles like a minimalist approach, well-structured content, a clear conveyance of a single key message, and concise text. This alignment with these frameworks further strengthens your infographic’s effectiveness.
Your method of crafting the infographic in Canva is truly commendable. Your meticulous incorporation of various design principles undeniably enhances its visual appeal and effectiveness. The addition of alternative text for learners with visual impairments is especially praiseworthy, demonstrating your unwavering commitment to accessibility and a profound understanding of the importance of equal access to information. Your infographic was both engaging and informative.
Your reflection exhibits a deep understanding of the module’s content and the core principles of inclusive design and accessibility. Your insights have added depth to my comprehension of Module 2, and I have full confidence that as you continue in this course, your materials will become increasingly inclusive and user-friendly for a diverse range of learners.
Nicole
Hi Maya!
I really enjoyed your module 2 blog response! I can tell you took your time to reflect on each individual question and created well thought out responses! I feel like we both had similar reactions to the WAVE accessibility report with the contrast errors. It is just never something I would have thought of either! It is cool that this helped us be aware for future design projects!
I loved how you thought to try different celebrity voices in your Text to Speech tool – I didn’t even know that was an option! I would of had a good laugh with Snoop Dog as well and could definitely see how Gwyneth Paltrow would be a great option for a strong understanding. I found your response to the inclusive design part almost to be perfect to my own idea of it. I feel like there is not always an awareness of inclusivity and accessibility for everyone in majority of things which makes it so important to highlight that not only in design but in everything. The captioning on videos is so helpful for myself as well as I find it helps keep my focus and I can keep up with videos better.
Finally your infographic is well laid out and great use of the design principles. After doing the WAVE accessibility report I found it easier to look for contrast of colours in my designs and I can see you were aware of it here as well as they aligned great. The information flowed well and it the font size was great for the message you were trying to display.
Can’t wait to keep reading your blog posts going forward!
Skye